"Chartered Financial Planners....Professionalism - Integrity - Excellence"
Thursday 29 January 2015
Another Indicator
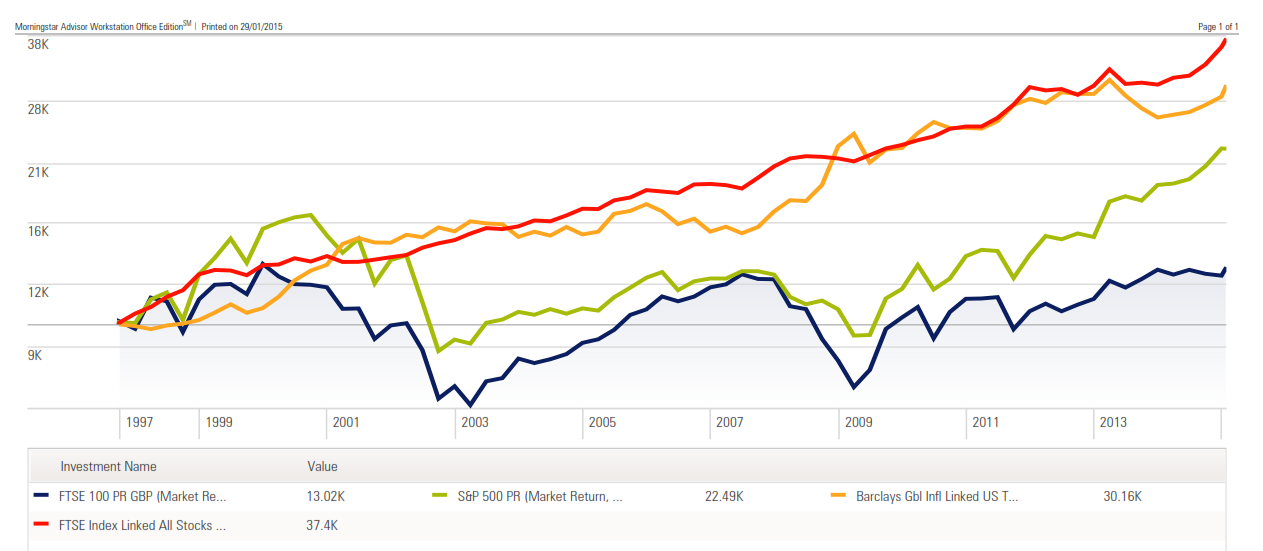
We have always been a fan of Index Linked Bonds, its difficult to put a price on the value of a "real return"; compare their performance to equities in the UK and the US to see why.
Weekly Round Up
We read an interesting update this week from GaveKal Capital about how an early indicator of declines in the broader market can be seen from weakness in the best performing stocks. On this basis the FTSE-100 may be safe for now as Ashtead Group has again moved forward after declines earlier in the year (Ashtead Group has returned 1365% since 1st March 2008)

However there may be signs of some stumbling from the next best performing shares - ARM Holdings and BTG Group - watch this space.
Overtime for the Printing Presses
At the time of writing (Thursday 22nd Jan) the European Central Bank has unveiled a new stimulus package of at least 1.1 trillion Euros, with interest rates also at record lows of 0.05% it seems that the ECB are concerned enough about the ailing Economy to forget their usual paranoia (inflation....hyperinflation of the 1920's was no fun, imagine going to do with weekly shopping!).


The stimulus programme, Central Bankers tells us, is aimed at stimulating the economy - however today's response by equity markets suggest that poor allocation of capital will continue and drive the "QE bubble" in equities even higher.
Which Way Next?
As you know from our previous weeks updates we have been busy looking at how we can build a framework for investment decisions that give us some clues as to where markets are heading next.
Last time we looked at some key indicators, such as trends moving averages and risk levels; this time we have a look at how we have used a selection of shares as "bellwethers" for the FTSE-100.
Using this shares we then calculate a simply average of their price ratios - for example Price Earnings Ratio, this is the current share price divided by the company earnings per share; a high price ratio means investors are willing to pay more for a shares earnings - we also use a few other reliable measures (6 in total) and use some maths to create an estimated return per annum for the next five years. Below are the results with the red line showing actual returns, as you can see there is a fair degree of accuracy.

To remove a bit of the "noise" we can create an average of these indicators, the graph below shows this which as you can see is pretty accurate - in fact statistics tell us that its about 75% correct (100% being exactly the same) and whilst this may not be perfect its a more than acceptable contributor to the decision making process.

Friday 9 January 2015
Any Changes?
Firstly Happy New
Year to all our clients and readers! We hope that you had an enjoyable
Christmas break. This is our first post for a couple of weeks due to the
holiday; but we have not been idle!
We will shortly be
providing a review of 2014 and outlook for the coming Year prior to this we
thought that it would do no harm to highlight some of the key indicators that
we use to help us with our investment recommendations.
We remain very close to all time highs for the UK Equity Market based on the FTSE-100.

The FTSE-100
continues to fluctuate, showing a disturbing level of short term volatility.

Overall our risk system
peaked in 2014 and is now declining - we would expect the FTSE-100 to follow as
it has previously; it remains unclear whether any decline would be
relatively short lived as in 2011 and 2012 or more substantial as in 2000 and
2008.

Some of the indicators that
make up the above graph continue to make us cautious in our outlook - the first
shows how the correlation of the FTSE-100 with its medium and small cap
counterparts is falling away (again repeating previous history).

As you know we like to look
at where we are in relation to history the graph below shows the distance of
the FTSE-100 to its five year high, currently it is within 10% of its five year
high and history again shows us this does not typically result in positive long
term gains – the red graph shows subsequent 5 year returns from each point;
since the turn of the Millenium when the index has been within
10% of its 5 year high future returns have been negative (the returns are
annualised so investing in 1999 resulted in investors receiving -9% per annum
for 5 years which equates to a loss of almost -54%).

Current conditions continue
to make us extremely cautious!
Friday 19 December 2014
Volatility
Below is a graph of the FTSE-100 but not over the long term that we usually look at; this chart is on an hourly basis from September 2014 where the index has traded between 6073 and 6773 - this range of 700 points equates to a change in price of over 11%!

Been here before..............................? The chart below shows the last 20 years of the same index and the FTSE-100 has clearly been here before! The blue lines show the same range and similar volatility in 1999-2000 and 2007-2008.


Been here before..............................? The chart below shows the last 20 years of the same index and the FTSE-100 has clearly been here before! The blue lines show the same range and similar volatility in 1999-2000 and 2007-2008.
Oil Price still on the slide
The FTSE 350 Oil & Gas Sector is following Oil Price downwardsFriday 12 December 2014
Weekly Round Up
This week we thought we would try a round up in a different format - click on the link below to view it on our website

Financial Planning Wales Weekly Round Up
Subscribe to:
Posts (Atom)